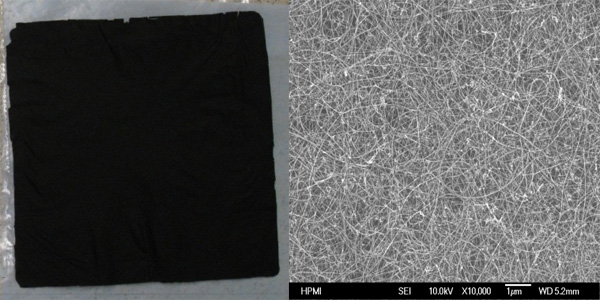
Carbon nanotubes (CNTs) have manifested exceptional mechanical, chemical, and electrical properties since their discovery in 1991 [1,2]. In practice, to fully achieve the exceptional properties of CNTs in the macro scale for composites, a major challenge is to achieve high loading, uniform dispersion and alignment of CNTs, and strong interface between CNTs and the matrix material in composites, while working with the small dimensioned CNTs.
Buckypaper, a membrane composed of entangled CNTs made by filtration of well-dispersed CNTs (Figure 1), is a promising method to overcome the above-mentioned challenges of CNTs. Since its induction in 2002 [3], buckypaper has been demonstrated with promising properties for practical or potential applications such as electromagnetic interference shielding [4], fire retardancy [5], and mechanical reinforcement [6]. The greatest challenge now is to scale up the capability of producing buckypaper from the lab scale to the commercial production scale, while maintaining consistent material quality of the produced buckypaper. What is pressingly needed, but currently missing, is the high-fidelity models that can predict the properties of buckypaper and its composites based on the raw materials and manufacturing process parameters. Such predictive models will enable the process and quality control in the nano-manufacturing processes as these models make it plausible to identify the critical variables for taking in-process measurements, and to direct the proper in-process adjustments or control actions.

A number of research efforts have attempted to predict various properties of buckypaper using various modeling techniques [7, 8]. Although most of these models can correctly predict the trends and effects of various parameters on the buckypaper properties, they normally produce large prediction errors/variations. These errors may be caused by the lack of complete understanding of materials/processing behaviors, the oversimplification of models, and the lack of adequate experimental data.
An effective approach to solving this problem is to develop statistical and computational methodologies that can significantly enhance the prediction capability using both physics-based models and available experimental data [9]. It is believed that the outputs from physics-based models and experimental data constitute a set of multi-accuracy information sources, reflecting the same (yet unknown) physical properties from different perspectives. Uniqueness of information embedded in individual datasets dictates that each dataset is a complement, rather than a replacement, of the other datasets. The conjecture is that combining the multi-accuracy information can achieve better predictions. Following this approach, an ongoing National Science Foundation collaborative research project between Georgia Institute of Technology (Drs. Chuck Zhang and Ben Wang), Texas A&M University (Dr. Yu Ding) and Florida State University (Drs. Arda Vanli and Richard Liang) is being conducted [10] to develop a Bayesian calibration and adjustment method for improving prediction accuracy of a physics-based (finite-element analysis (FEA)) mechanical property model with experimental data. In this study, the model calibration and adjustment methodology was developed and tested for predicting modulus of poly(vinyl alcohol) (PVA)-treated buckypaper. The Bayesian additive model proposed by Wang et al. was used [11]. Since most of the uncertainty in the nanostructure characterization lay in the CNT length measurement, the average CNT length was chosen as the calibration parameter.

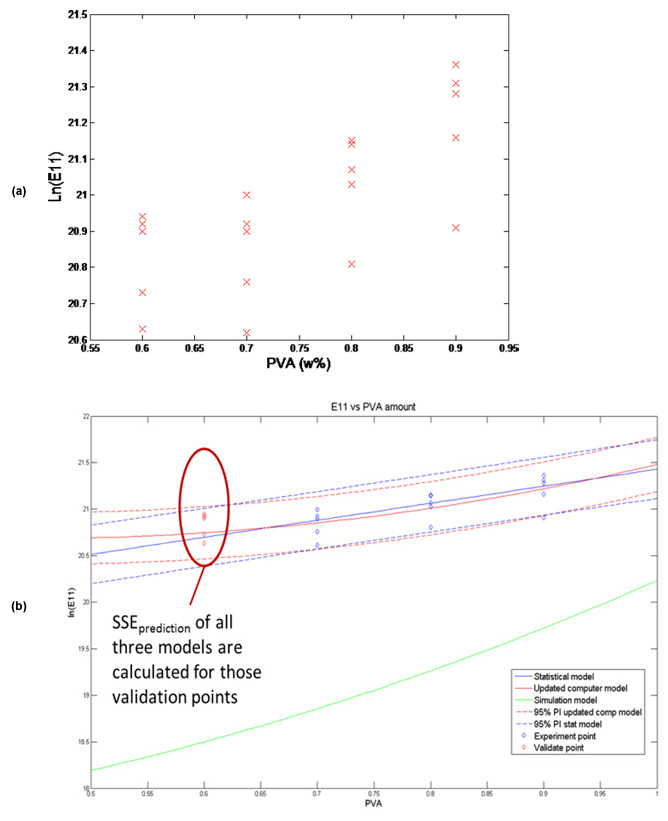
In order to calibrate and test the models, experimental data were collected from 20 PVA-treated buckypaper samples at four different PVA levels, 0.6, 0.7, 0.8 and 0.9, with five replications at each PVA level. Figure 2(a) shows the buckypaper modulus measurement data. Figure 2(b) illustrates the prediction results from three types of models: statistical model from regression, FEA (simulation) model, and calibrated/adjusted (updated computer) model.
The calculated sum of squared error (SSE) of the prediction from the updated computer model was 0.11, compared to 0.16 from the statistical/regression model (a 31% reduction). This indicates that the calibrated/adjusted model has a higher predictive power due to the inclusion of prior knowledge from the physics-based model. This case study shows that the model calibration and adjustment method can be an effective tool for enhancing model prediction capabilities, particularly for nanomaterials and nanomanufacturing applications where limited experimental data and inadequate physics-based models are common.
References
[1] Lu W and Lieber CM. 2007. Nanoelectronics from the bottom up. Nature Materials 6(11): 841-850.
[2] Zhu W, Zheng JP, Liang Z, Wang B, Zhang C, Au G and Plichta EJ. 2010. Ultra-low platinum loading high-performance PEMFCS using buckypaper-supported electrodes. Electrochemistry Communications 12(11): 1654-1657.
[3] Sreekumar TV, et al. 2002. Single-wall carbon nanotube films. Chemistry of Materials 15(1): 175-178.
[4] Park JG, Louis J, Cheng QF, Bao JW, Smithyman J, Liang R, Wang B, Zhang C, Brooks JS, Kramer L, Funchess P, and Dorough D. 2009. Electromagnetic interference shielding properties of carbon nanotube buckypaper composites. Nanotechnology 20-415702.
[5] Wu Q, Zhang C, Liang Z and Wang B. 2008. Fire retardancy of the buckypaper membrane. Carbon (46)1164-1165.
[6] Wang Z, Liang Z, Wang B, Zhang C, and Kramer L. 2004. Processing and property investigation of single-walled carbon nanotube (SWNT) buckypaper/epoxy resin matrix nanocomposites. Composite, Part A: Applied Science and Manufacturing 35(10): 1225-1232.
[7] Zhupanska OI. 2013. The Effect of Orientational distribution of nanotubes on buckypaper nanocomposite mechanical properties. Mechanics of Advanced Materials and Structures 20(1):1-10.
[8] Jack DA, Yeh CS, Liang Z, Li S, Park JG, and Fielding JC. 2010. Electrical conductivity modeling and experimental study of densely packed SWCNT networks. Nanotechnology 21-195703.
[9] Pourhabib A, Ding Y, Huang J, Zhang C, and Wang K. 2013. Latent variable-based multi resolution analysis for modulus prediction of PVA-treated buckypaper. ISERC 2013 Conference, San Juan, Puerto Rico, May 18-22.
[10] Wang K, Vanli A, Zhang C, and Wang B. Model calibration and adjustment of 2D truss model for predicting Young’s modulus of poly(vinyl alcohol)-enhanced carbon nanotube sheet. Working paper submitted to Journal of Manufacturing Systems.
[11] Wang SC, Chen W, and Tsui KL. 2009. Bayesian validation of computer models. Technometrics 51(4): 439-451.
